
Computational Resources
MSD-LIVE harnesses the power of Amazon Web Services cloud infrastructure to provide secure, scalable, on-demand computing solutions for MSD projects.
In Situ Dataset Exploration
Our newest computational offering is the ability to explore datasets directly in MSD-LIVE via Jupyter notebooks.

Explore In Situ Dataset Exploration
Uncertainty Characterization eBook
Created by the IM3 project, the UC eBook is a living guide to sensitivity analysis and diagnostic model evaluation techniques for confronting the computational and conceptual challenges of multi-model, transdisciplinary workflows.
Model Training Notebooks
MSD projects use cloud-computing capabilities in MSD-LIVE to create interactive Jupyter notebooks that train users to configure, run, and analyze MSD models.
Go to Model Training Notebooks Overview
Model Training Notebook Resources
demeter
demeter is an open-source land use and land cover change disaggregation model.
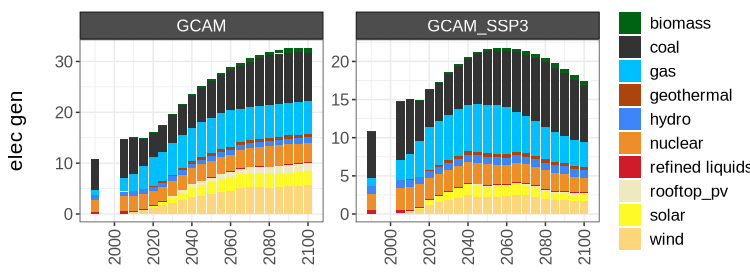
gcam
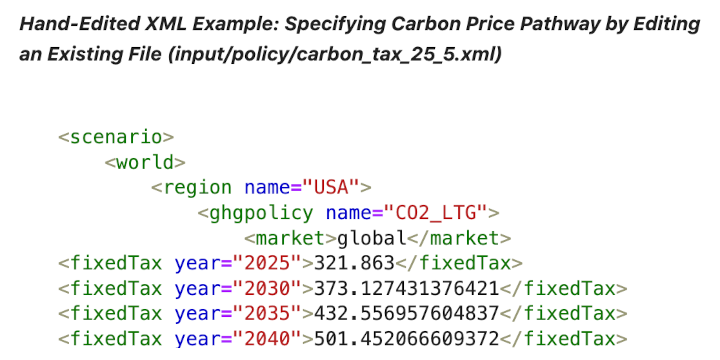
A demonstration on how to conduct scenario adjustments and user modifications in GCAM, including scenario design and methods for creating and editing scenarios.
gcamwrapper
gcamwrapper contains C++, R, and Python source code that wraps GCAM so simulations can be run interactively.
hector
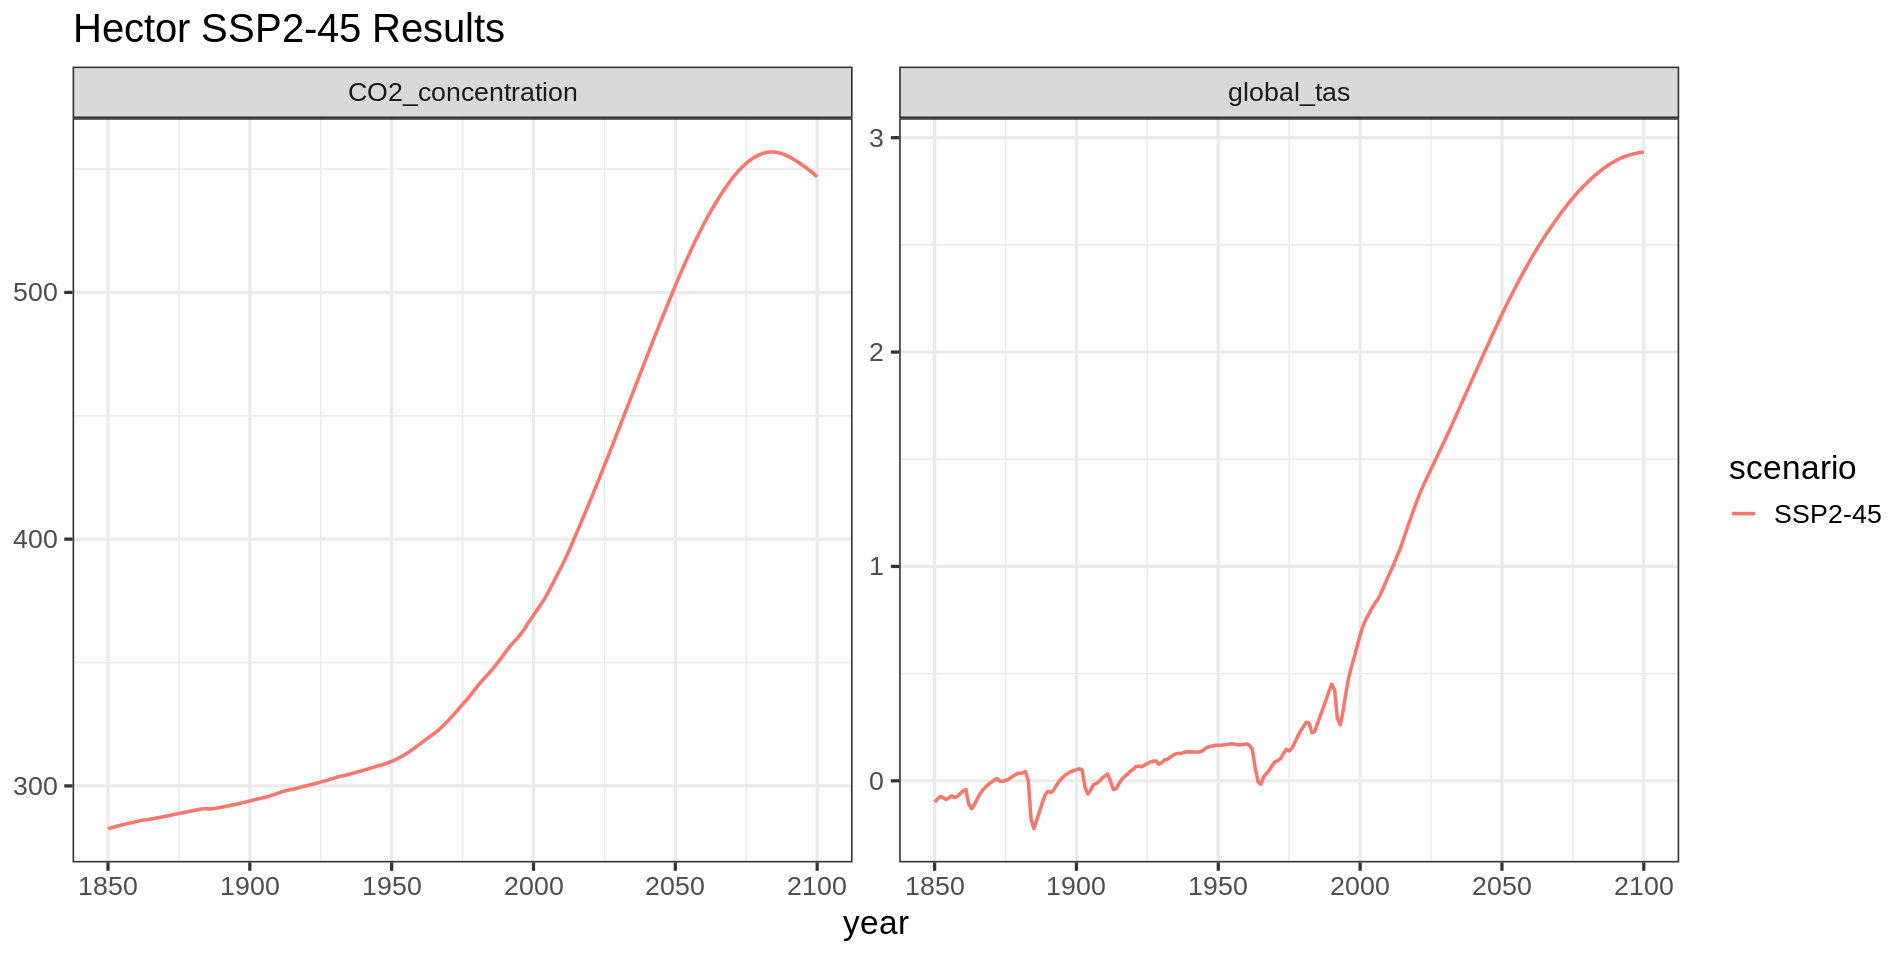
hector is a simple climate model that can be embedded with GCAM.
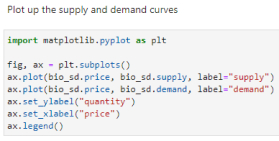
matilda
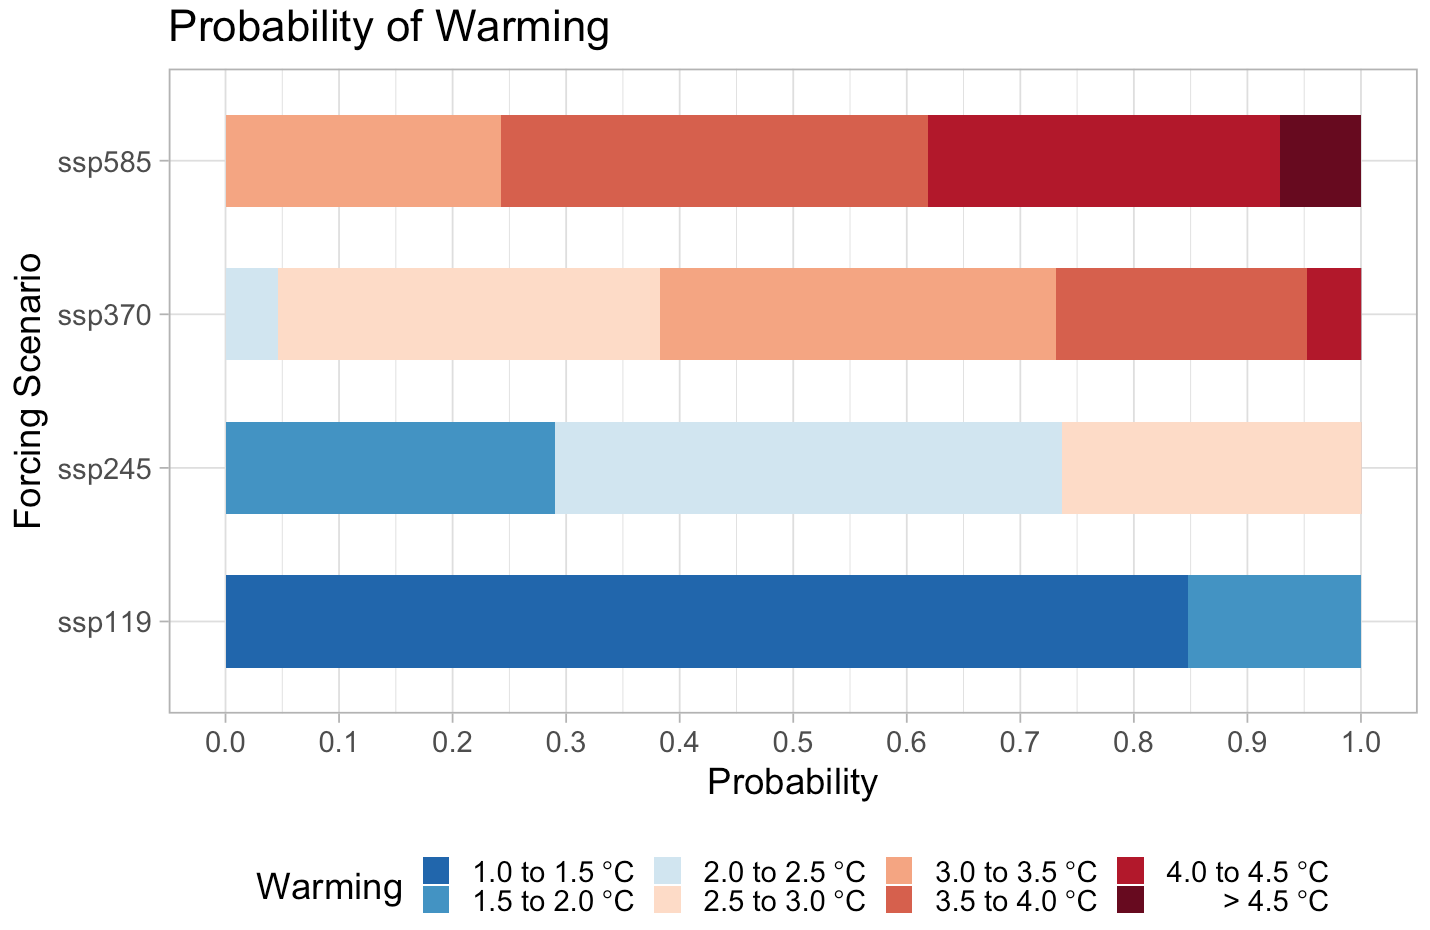
matilda is a probabilistic framework for the hector simple climate model.
rgcam
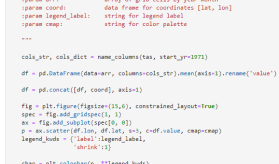
rgcam is an open-source package used to interact with GCAM outputs (rgram, rchart, and rmap).
statemodify
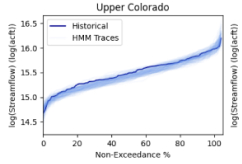
statemodify is an open-source Python package for modifying StateMod input and output files to enable exploratory modeling.
stitches
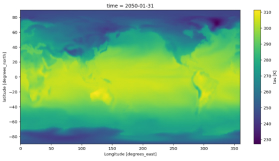
stitches is a computationally efficient emulator that preserves temporal and spatial resolution and joint coherence of multiple climate model output variables.
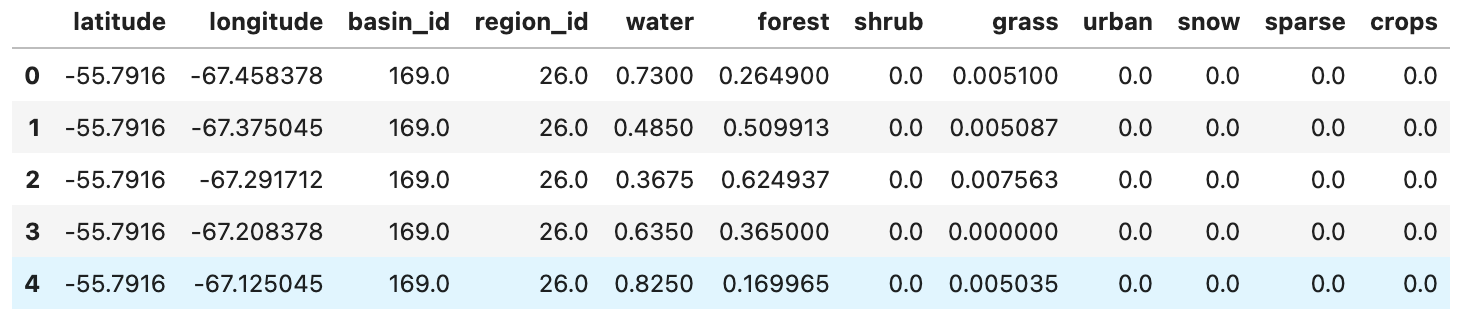
tethys
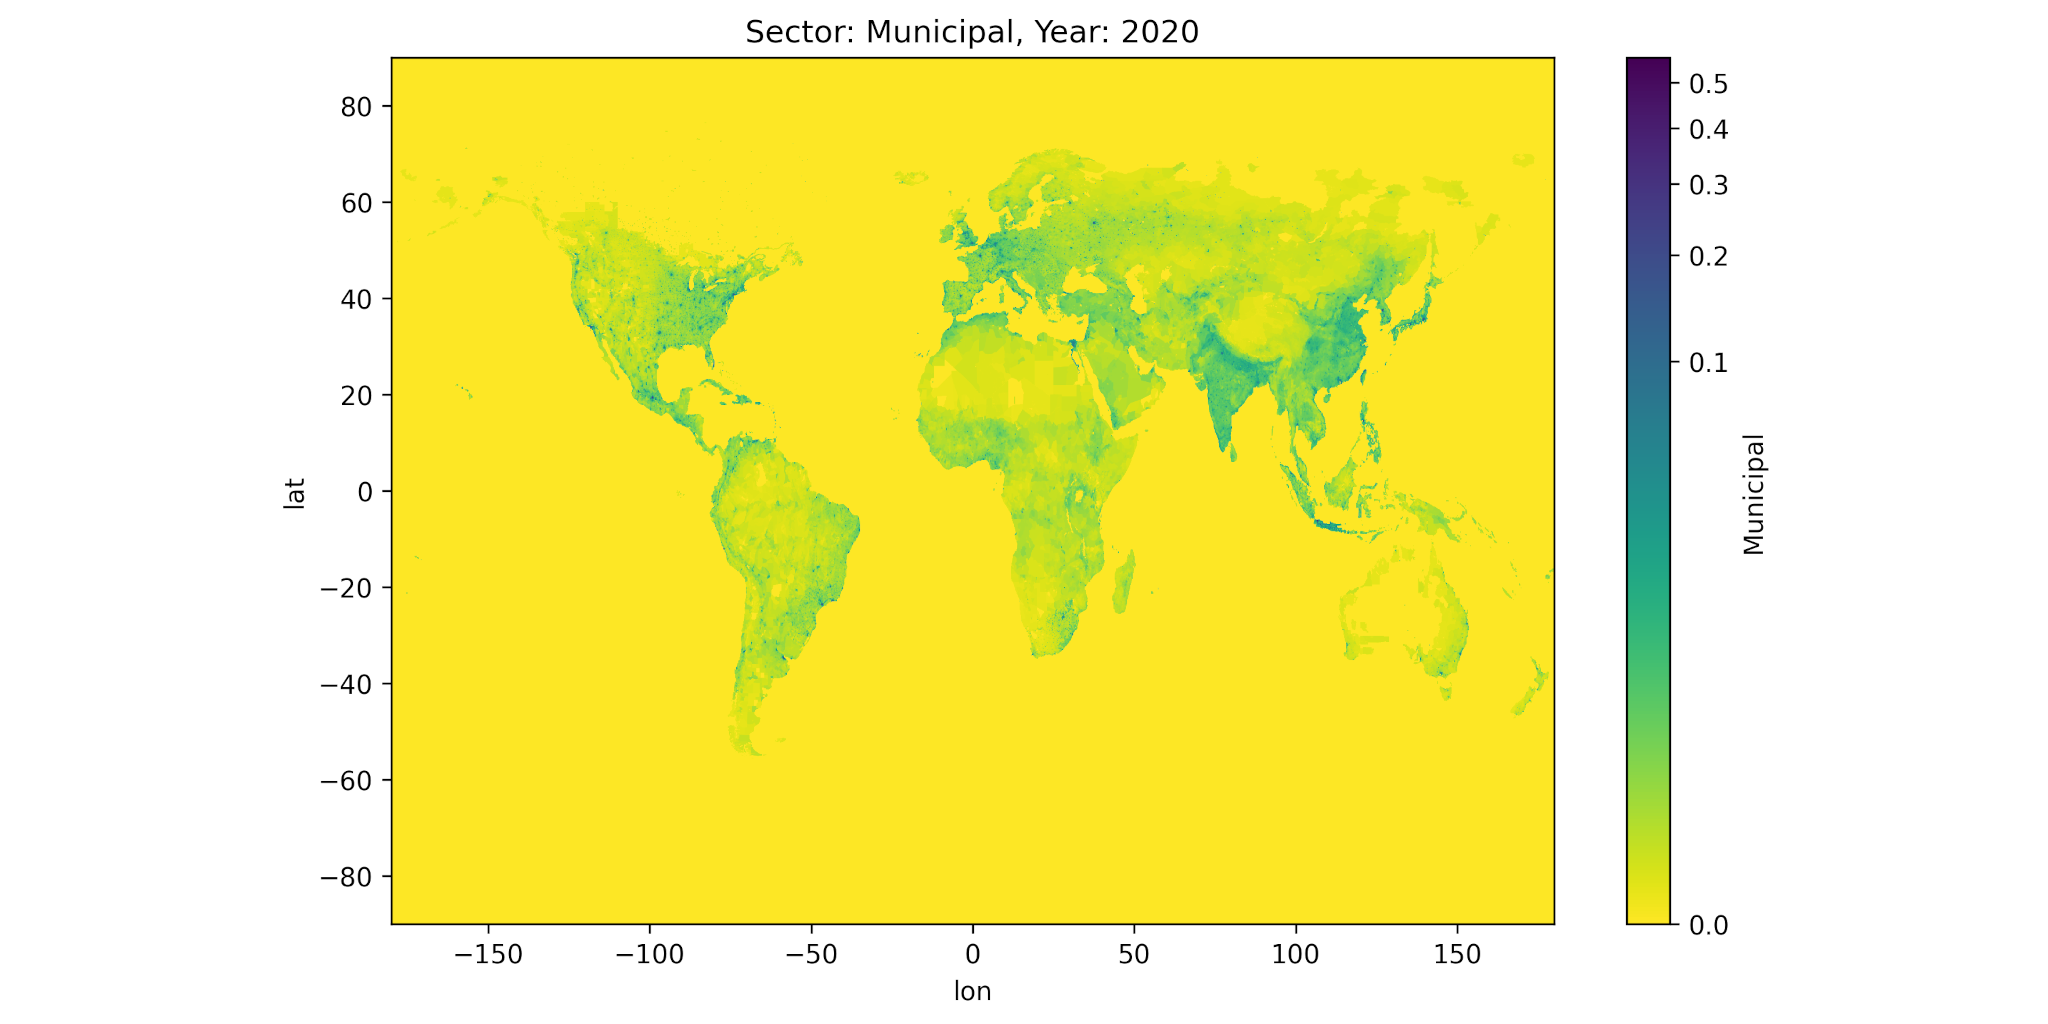
tethys facilitates coupling between large-scale and fine-resolution models by downscaling region-scale water demand onto a grid.
xanthos
xanthos is an open-source hydrologic model written in Python that simulates historical and future global water availability on a monthly time step.
Interactive Data Dashboards
MSD-LIVE users can create interactive data dashboards that allow downstream users to explore and visualize datasets without downloading the underlying data.
Go to Interactive Dashboards Overview
Interactive Dashboard Resources
lafferty-sriver-2023-downscaling-uncertainty
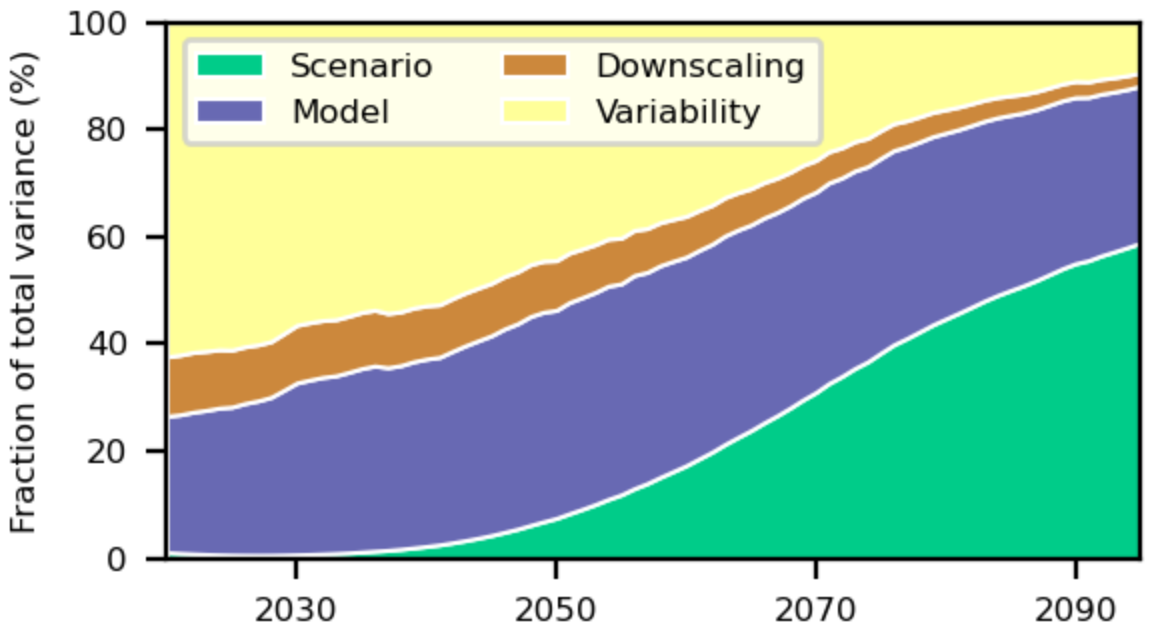
This interactive dashboard allows users to create visualizations of the dataset underpinning the Lafferty and Sriver 2023 paper published in NPJ Climate and Atmospheric Science.
ICoM RAFT Hurricane Projections Dataset
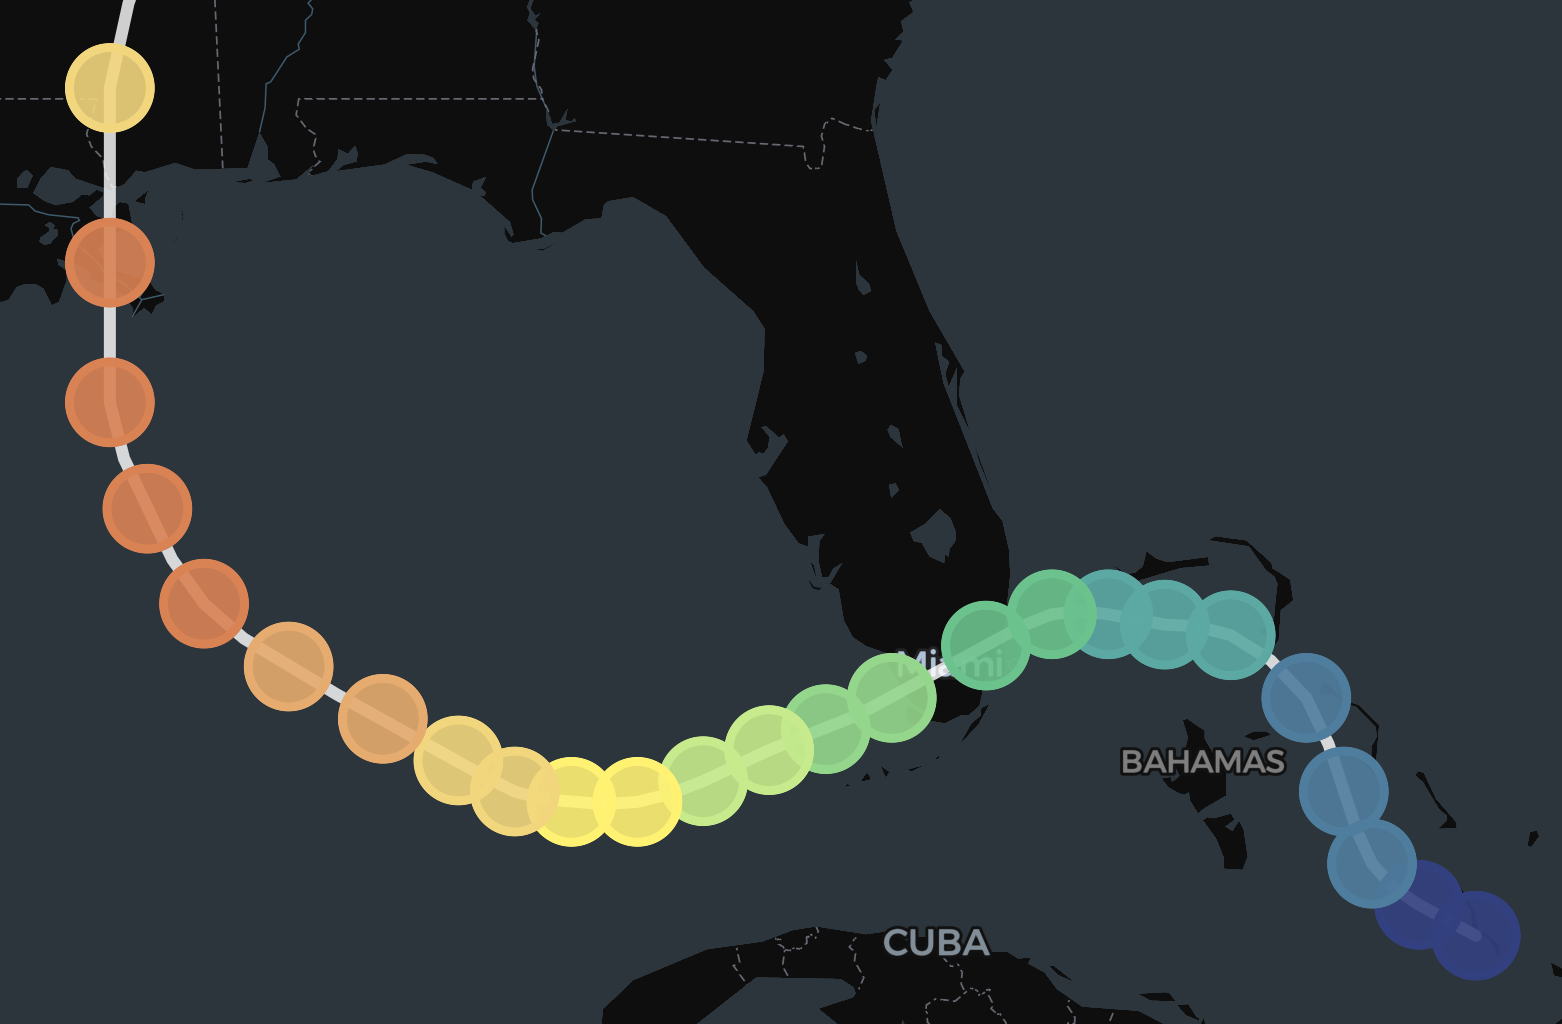
This dashboard visualizes 620 historic tropical cyclones from 1979 to 2018 replayed under eight future climate scenarios.